Log it, and the rest happens
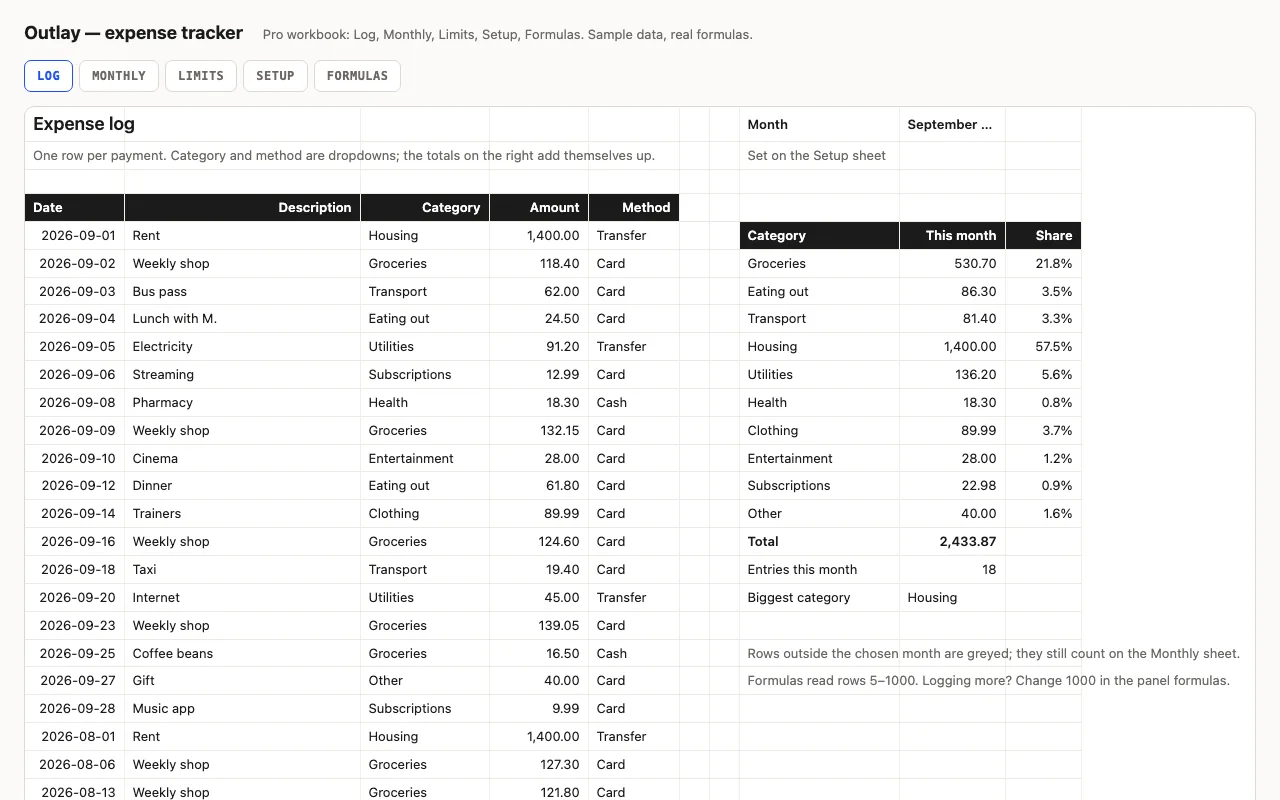
One row per payment. Category and method come from dropdowns, so a mistyped word can never
hide a row from the totals. The panel beside the log adds up the month you chose — by
category, with a bar for each — counts the entries, and names the category that took the most.
Pro: a year at a glance, and limits that push back
The Monthly sheet is twelve months across ten categories, every cell a SUMIFS, with data bars
so the heavy months show. The Limits sheet puts each category against the limit you set on
Setup: what’s left turns red when you’re over, and the “used” bar fills to 100% and then the
number goes red. Rename a category once on Setup and the dropdown, the grid and the limits
follow.
The Formulas sheet lists the eleven calculations in the workbook and says what each does —
including why the ranges stop at row 1000 and how to raise it.
Checked, not just built
The build recalculates the workbook in LibreOffice and in a second, independent engine on the sample data and compares
twelve totals against numbers computed outside Excel. If any drift, the file doesn’t ship.