A Gantt chart you can edit
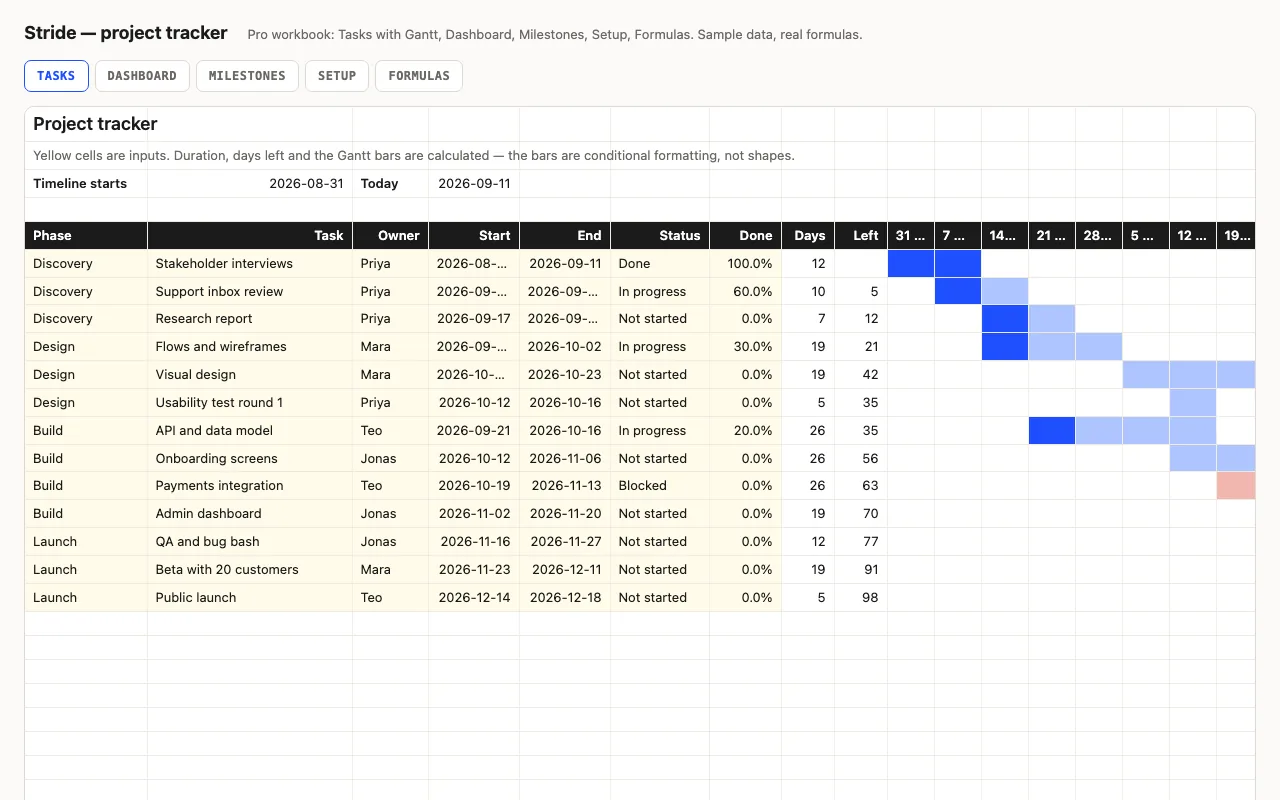
Most Gantt templates are shapes positioned by a macro; change a date and nothing moves. Stride’s bars are conditional formatting on a grid of weeks, so they follow the dates, fill with the Done percentage, turn red when blocked, and show a line on the current week. The three rules are on the Formulas sheet, and extending the timeline is copying a column.
The numbers a status meeting needs
The Pro Dashboard counts tasks by status, flags anything overdue, lists what’s due this week, and gives an overall progress figure weighted by task length. Per owner: open tasks and the days of work left. Milestones shows the dates that matter and how much of the phase behind each is done.
The checklist
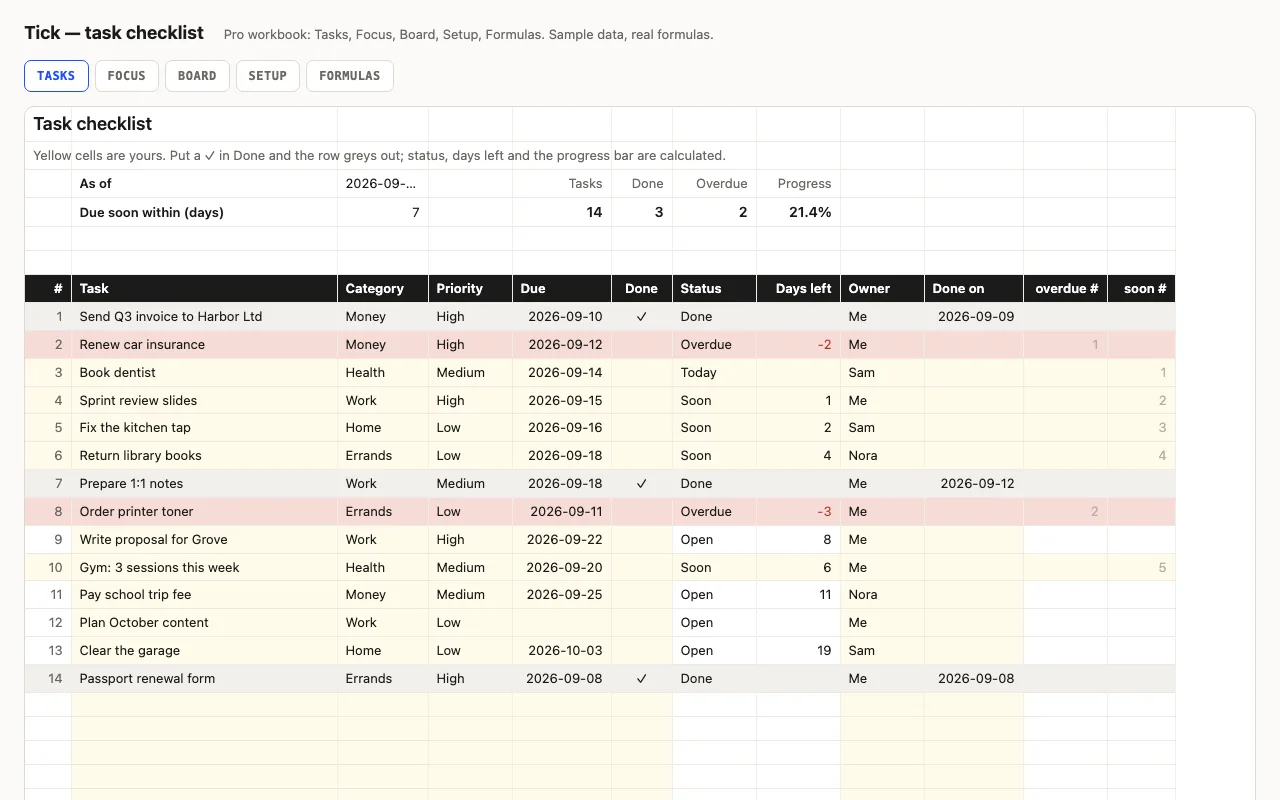
Tick is the other side of project work: a to-do list with an “as of” date. Every row compares its due date to it — Overdue, Today, Soon, Open — and a ✓ finishes it. Pro adds a Focus sheet that lists the overdue and due-this-week tasks by plain INDEX/MATCH (no FILTER, so Excel 2016 and Numbers are fine) and a Board of counts per category, person and priority.
What the free version includes
The Tasks sheet with a 12-week Gantt and a credit line kept. Pro: 26 weeks, Dashboard, Milestones, Setup, formulas walkthrough.