A Gantt chart you can actually edit
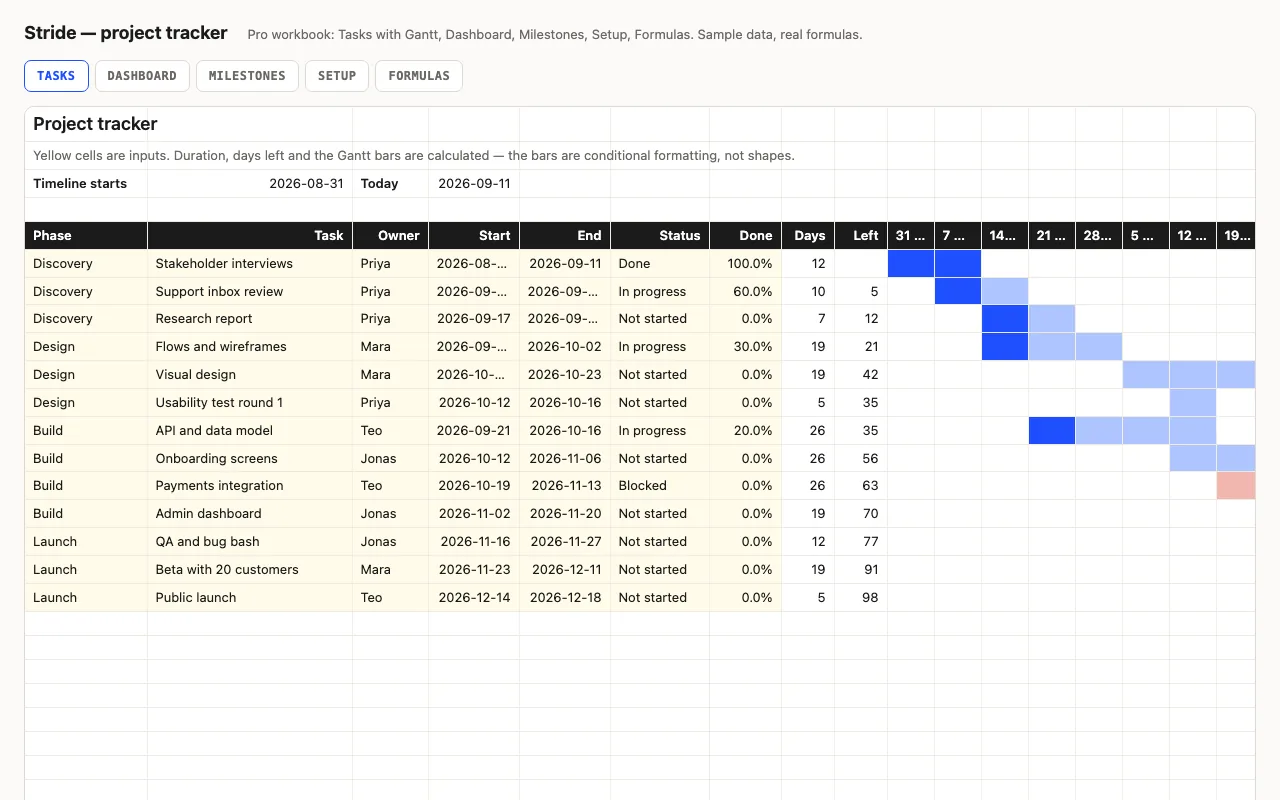
Most Gantt templates are shapes on a grid, or a macro that redraws them. Change a date and
the bar doesn’t move. Stride’s bars are conditional formatting: each week column tests whether
its week overlaps the task’s dates, and shades itself if so. Change the date, the bar moves.
Type 40% in Done and the first 40% of the bar goes solid. Set the status to Blocked and it
turns red. There is a red line on the column that contains today.
Pro: where the project stands, in numbers
The Dashboard counts tasks by status, flags anything past its end date, lists what’s due in
the next week, and gives an overall progress figure weighted by task length — so a three-week
task counts three times a one-week one. Per owner: open tasks and the days of work left in
them. Milestones shows the dates that matter, how far away they are, and how much of the
phase behind each is done.
The three rules, written down
The Formulas sheet shows the exact conditional-format formulas that draw the planned bar, the
done bar and the blocked bar, and explains the “progress front” arithmetic. Extend the
timeline by copying the last week column; the rules come with it.
Checked, not just built
The build recalculates the workbook in LibreOffice and in a second, independent engine on the sample plan and compares fifteen values —
durations, days left, status counts, weighted progress, per-owner load — against numbers
computed outside Excel.